| Q.1 |
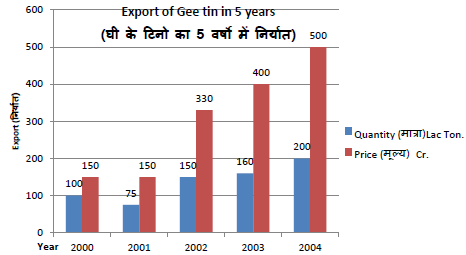
Read carefully the bar graph below and answer the questions below.
In Years 2003 and 2004, what was the difference in the number of exported Tins.
View Answer Discuss on Question Error In Question |
| Q.2 |
Read carefully the bar graph below and answer the questions below.
How much export percentage increased From 2001 to 2005?
View Answer Discuss on Question Error In Question |
| Q.3 |
Read carefully the bar graph below and answer the questions below.
How much percentage decreased the number of export from 2001 to 2002?
View Answer Discuss on Question Error In Question |
| Q.4 |
Read carefully the bar graph below and answer the questions below.
|
| Q.5 |
Read carefully the bar graph below and answer the questions below.
If the rate of tin was same in 2004 that was in 2003 then in 2004 what was the export value in carore ?
View Answer Discuss on Question Error In Question |
| Q.6 |
Read carefully the bar graph below and answer the questions below.
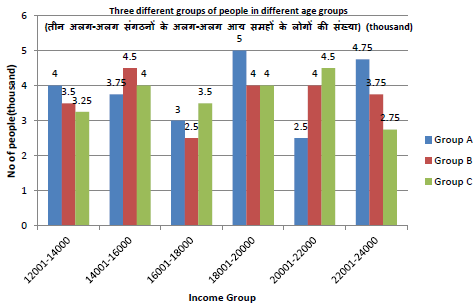
All income groups including the organization C is the total number of individuals?
View Answer Discuss on Question Error In Question |
| Q.7 |
Read carefully the bar graph below and answer the questions below.
What is the maximum number of persons in the income group?
View Answer Discuss on Question Error In Question |
| Q.8 |
Read carefully the bar graph below and answer the questions below.
Composition B of 12,001 to 14,000, from 14,001 to 16,000 and from 18,001 to 20,000 individuals in the income group of the total organization A number of individuals from the same income groups, respectively, what is the ratio?
View Answer Discuss on Question Error In Question |
| Q.9 |
Read carefully the bar graph below and answer the questions below.
22001- 24000 number of individuals of all income groups, income groups, what percentage approximately to the number of individuals?
View Answer Discuss on Question Error In Question |
| Q.10 |
Read carefully the bar graph below and answer the questions below.
Organization of C income groups from 16001 to 18000 the number of people in the same income group A and B is what percentage of the number of groups?
View Answer Discuss on Question Error In Question |
| Q.11 |
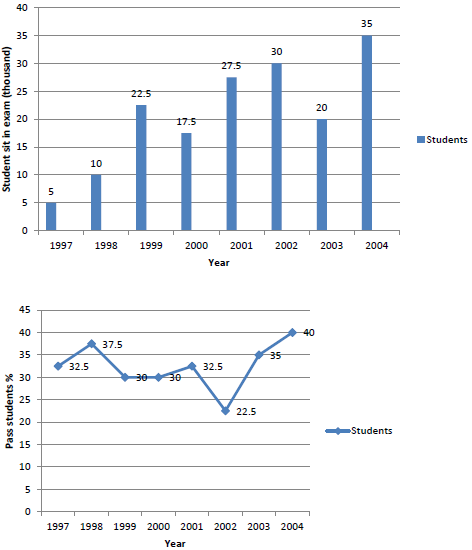
By studying the graphs below carefully answer the questions below.
what was the ratio betwen the numbers of examinees in1997 and number of passed students in 2004?
View Answer Discuss on Question Error In Question |
| Q.12 |
By studying the graphs below carefully answer the questions below.
From the given years in which year the number of student was minimum passed?
View Answer Discuss on Question Error In Question |
| Q.13 |
By studying the graphs below carefully answer the questions below.
In 2002 to 2003 how much percentage decreased of examinees appeared in the examinations?
View Answer Discuss on Question Error In Question |
| Q.14 |
By studying the graphs below carefully answer the questions below.
|
| Q.15 |
By studying the graphs below carefully answer the questions below.
what was the percentage of number of students passed the examination in 1999 from number of students appeared in the examinations ?
View Answer Discuss on Question Error In Question |
| Q.16 |
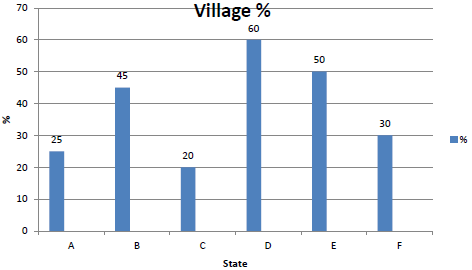
In Figure 6 below states percentage of those villages, which is not electrified. The careful study and answer the questions below?
If the central government for the electrification of low electrification states starts more Electrified by giving financial assistance to States, which state will be the fourth?
View Answer Discuss on Question Error In Question |
| Q.17 |
In Figure 6 below states percentage of those villages, which is not electrified. The careful study and answer the questions below?
In the comparision of state d which state is double electrified ?
View Answer Discuss on Question Error In Question |
| Q.18 |
In Figure 6 below states percentage of those villages, which is not electrified. The careful study and answer the questions below?
In sate B how many % of villages has been electrified ?
View Answer Discuss on Question Error In Question |
| Q.19 |
In Figure 6 below states percentage of those villages, which is not electrified. The careful study and answer the questions below?
How many states 60% or more villages has been electrified?
View Answer Discuss on Question Error In Question |
| Q.20 |
In Figure 6 below states percentage of those villages, which is not electrified. The careful study and answer the questions below?
|